Hi Everyone,
It's time to say bye-bye to ask the Users to send fiddler traces as we can monitor every thing from our machine and analyze what exactly we need using Monitor.
Monitor provides you all client-side network of the app on which you can start analysis on the same. I think, it is most useful for the Microsoft Support Team and Product Team as they need the traces from the users to understand the issues and they normally guide with the steps that are needed to log the traces using Fiddler. Now, they can say bye-bye to those and just pass on the URL to the join the monitor debug session and trace everything. However, it would be useful for Technical Consultants as well to understand what is going wrong with the Performance, Script Errors, Form Events etc...
Let's see how it works.
Select the Model-driven app and right click on it, you will see an option as Monitor.


A new tab will open upon clicking on Monitor button with the button as below.


Hit on Play model-driven app and it opens the App asking you to join the monitor session. If you want, you can join or we can copy the URL and give it to the user to open and perform the actions which they would like to do.


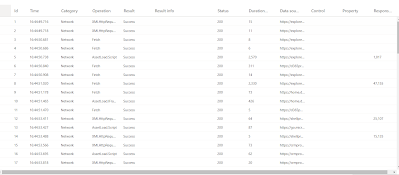
Once the Users join the session, navigate and perform actions whatever you want, you will see the complete traffic from the app is captured in the Monitor window.

As of now, the following events are supported.
- KPI for page loads, command executions, and other major events
- Network request details
- Warnings for synchronous XHR’s
- Custom script errors (e.g. onload, ribbon rule evaluation)
- Form execution event details (e.g. onload, onchange)
- Form visibility reasons for controls and related menu items
- Power BI control failure and performance events
Refer PowerApps blog post for more information.
Hope this helps.
--
Happy 365'ing
Gopinath.
No comments:
Post a Comment